Making positive impact
2023 Annual Report
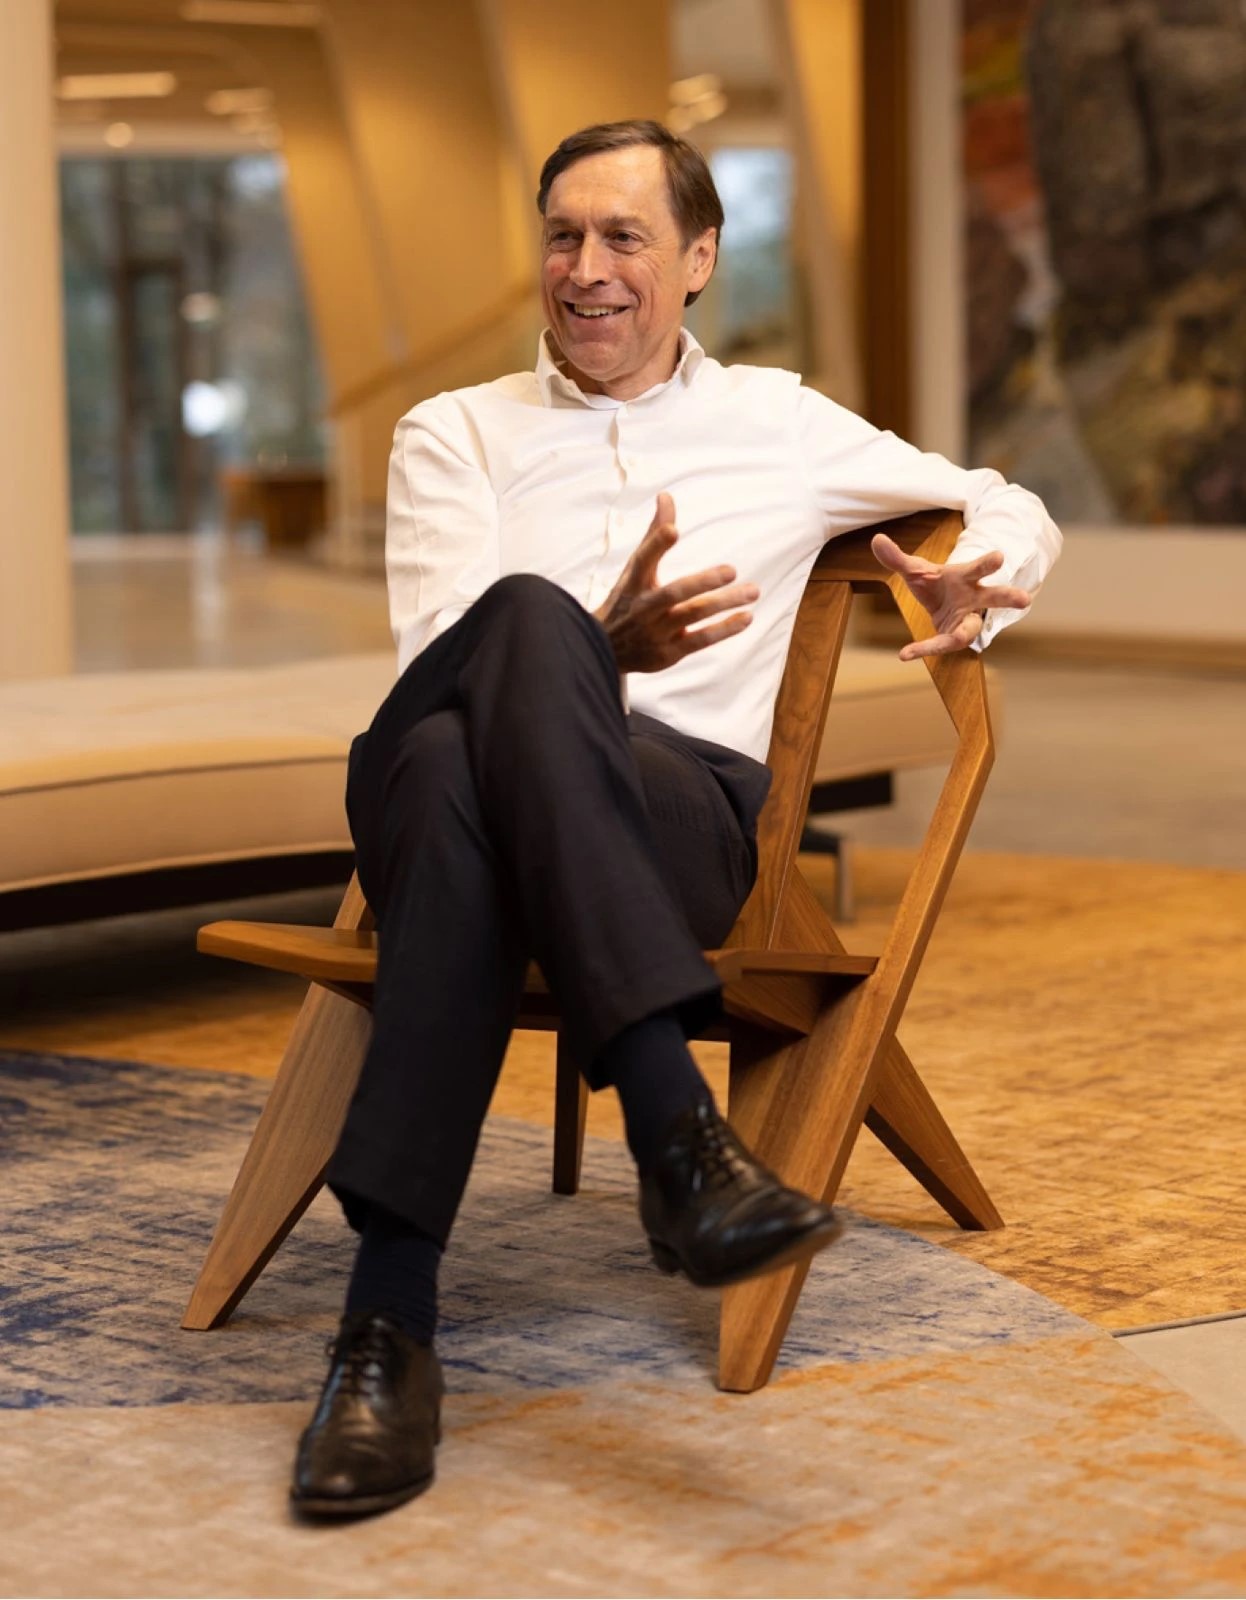
The strong results we achieved in 2023, the best ever in Triodos Bank’s history, demonstrate that our business model to combine positive impact with solid financial results is fulfilling a need.
Impact
Making money work for positive change

Making money work for positive change
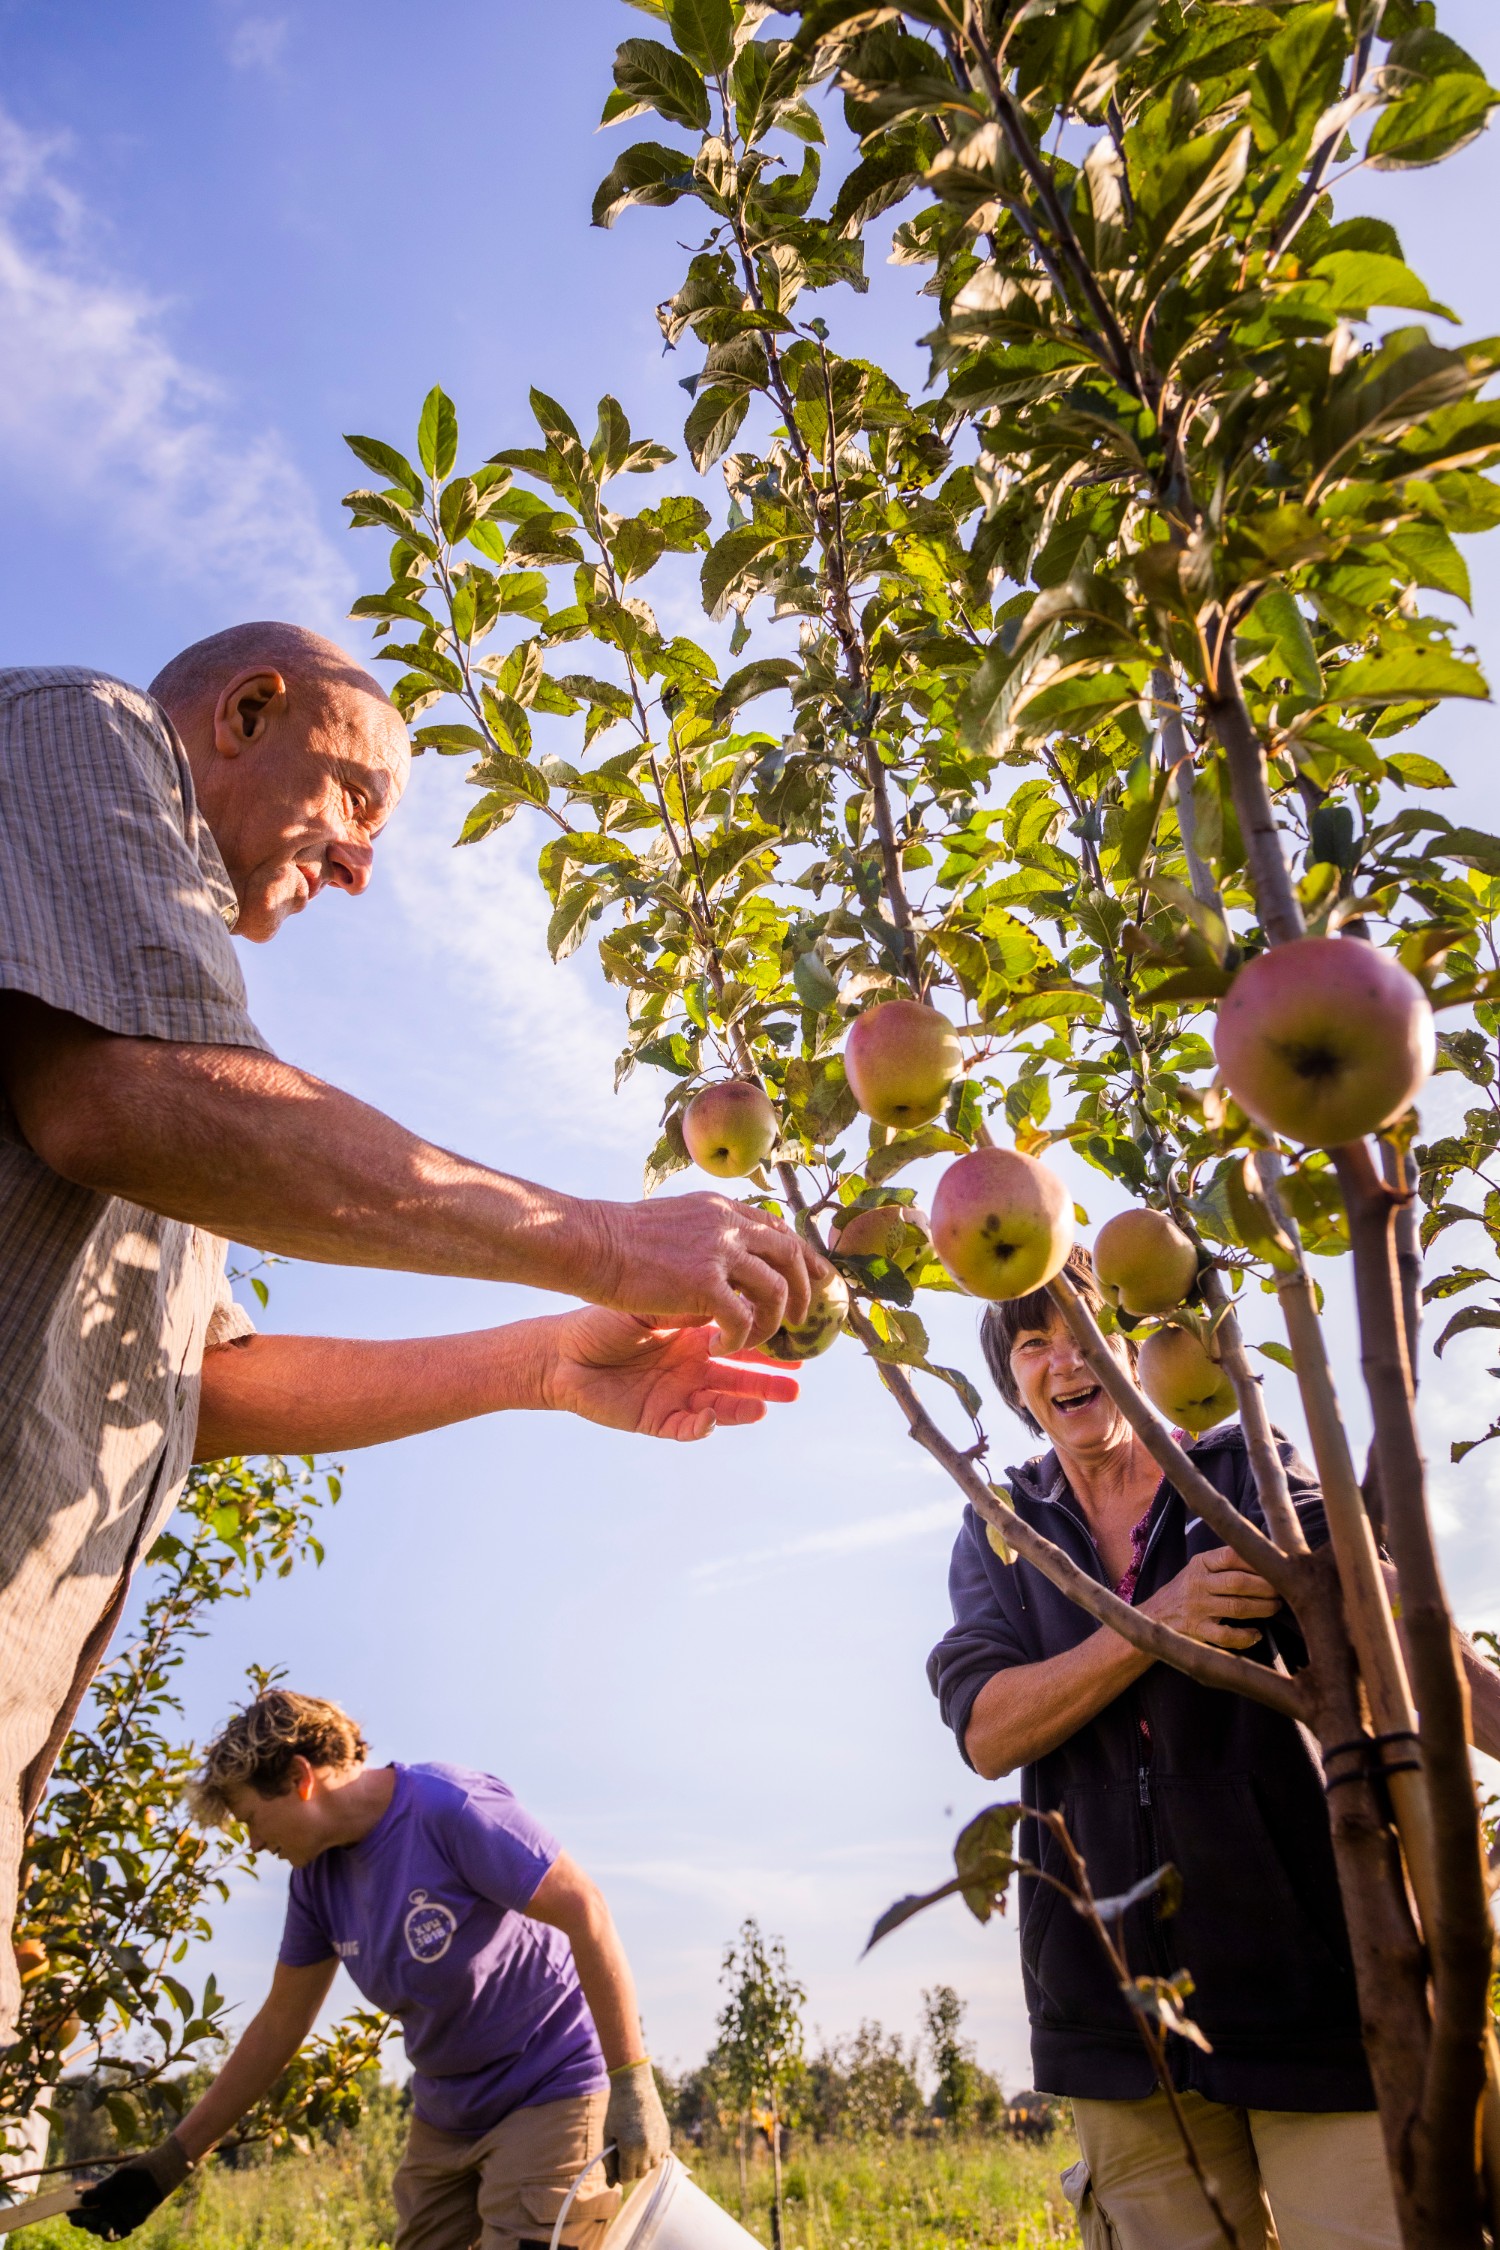
From the beginning, Triodos Bank has championed the conscious use of money and its direct impact on the world. We have always envisioned a world in which all people have the necessary tools and resources to live fulfilling lives, and in which the economy operates in harmony with nature. We do this by enabling individuals, institutions and businesses to use money more consciously to make money work for positive social, environmental and cultural change.
2023 at a glance
Highlights
Ranked #1 globally for most active clean energy lead arranger by total number of deals
First bank globally to join the global campaign for a proposed Fossil Fuel Non-Proliferation Treaty
Tradability in Triodos Bank Depository Receipts restored on a Multilateral Trading Facility platform
Impact
640 renewable energy projects were financed avoiding 996 ktonne CO2e emissions
45,200 people were residents at 617 care homes for older people financedby Triodos Bank
252 ktonne CO2e net emissions from outstanding loans and investments
Financials
6.1% return on equity
73% cost to income ratio
77.2 million net profit
People
1851 co-workers, of whom 50% are women
4.9 ratio highest paid co-worker to median salary
746,479 customers